Spectrum Analyzer vs Oscilloscope: Which Instrument Do You Actually Need?
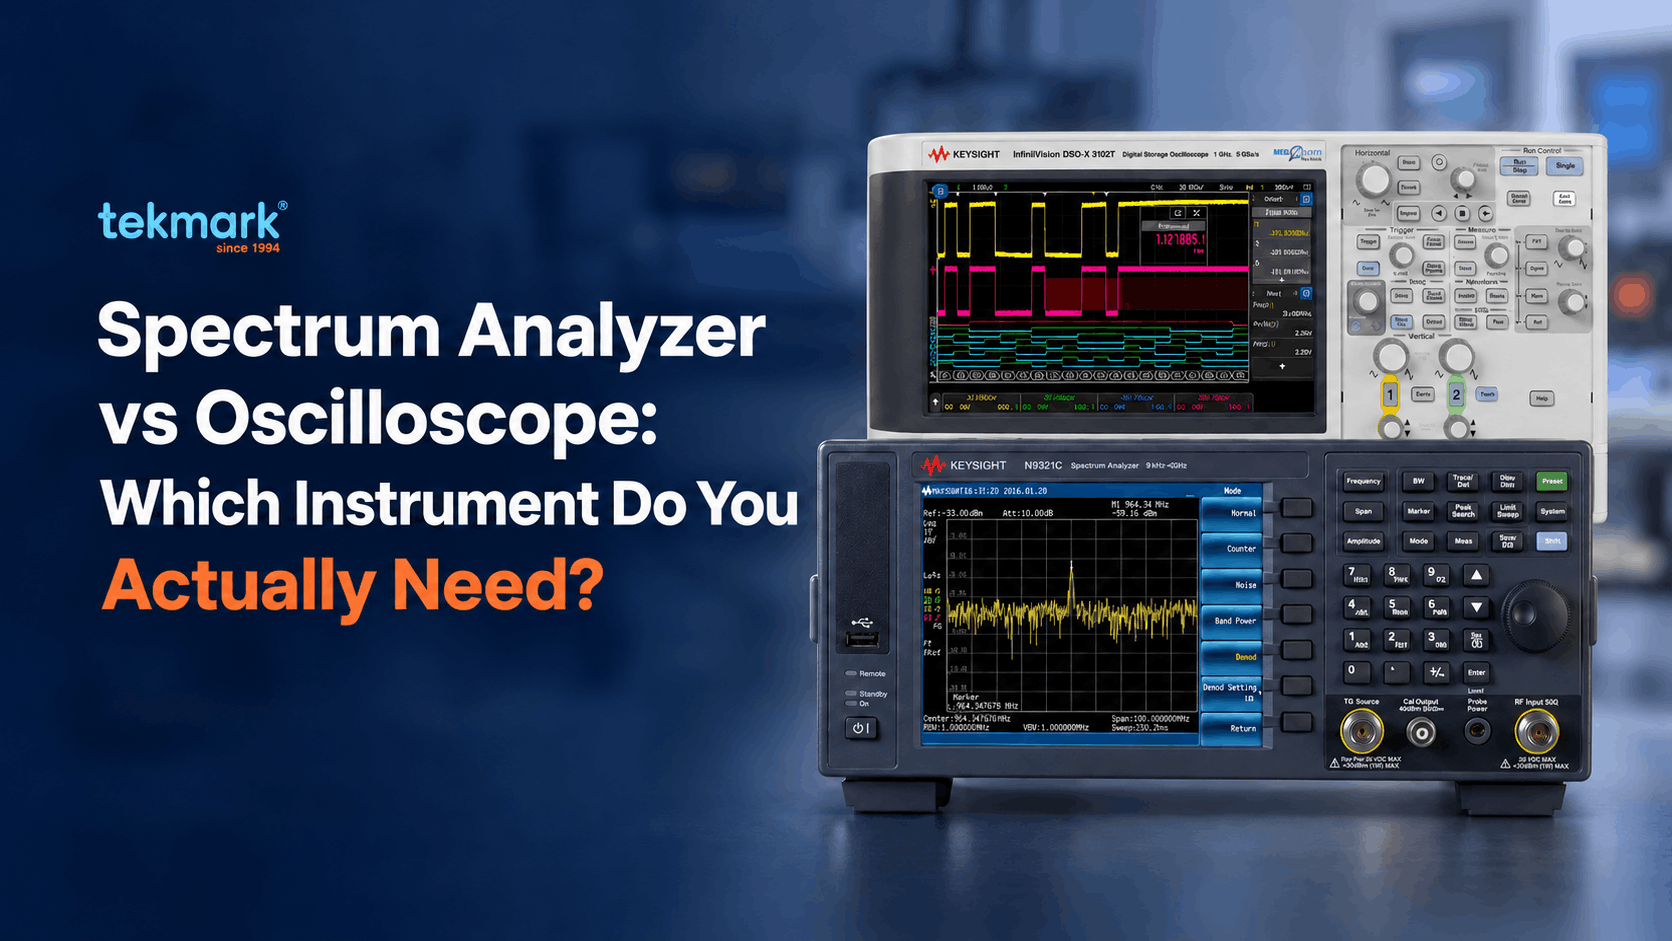
An oscilloscope and a spectrum analyzer can both help engineers examine electrical signals, but they present those signals from different perspectives.
An oscilloscope primarily displays voltage over time, making it the preferred instrument for analysing waveform shape, timing, rise time, glitches and transient behaviour.
A spectrum analyzer displays signal power levels in frequency domain, making it better suited to measuring harmonics, spurious signals, noise, interference and RF emissions.
Modern oscilloscopes can use Fast Fourier Transform, or FFT, to display the frequency components of a captured waveform. However, an oscilloscope FFT does not automatically provide the same frequency resolution, sensitivity or calibrated RF measurement performance as a dedicated spectrum analyzer.
The right choice depends on what you need to measure: signal behaviour over time, detailed spectral content, or both.
Key Takeaways
- An oscilloscope measures voltage over time. It reveals waveform shape, timing, glitches, and transient behaviour.
- A spectrum analyzer measures power across frequency. It reveals harmonics, spurs, phase noise, and RF emissions.
- Oscilloscope FFT works for basic frequency analysis and correlating spectral content with switching or timing events.
- Choose a dedicated RF spectrum analyzer for weak-signal sensitivity, narrow resolution bandwidth, or calibrated RF measurements.
- For intermittent RF signals, a real-time spectrum analyzer can provide better visibility than a conventional swept spectrum analyzer by continuously processing the spectrum within its real-time analysis bandwidth.
- Keysight X-Series Signal Analyzers combine spectrum-analysis capability with configurable measurement applications for tasks such as phase-noise, noise-figure and modulation analysis. Available measurements depend on the analyzer model and installed software licences.
- Keysight FieldFox handheld analyzers are designed for portable RF and microwave measurements in applications such as interference hunting, field maintenance, spectrum monitoring and EMI troubleshooting.
What Each Instrument Actually Measures
An oscilloscope digitises voltage over time. Its ADC captures the waveform across the selected bandwidth and sample rate, and an FFT converts a portion of that time record into a frequency-domain view.
This makes the oscilloscope particularly useful when you need to answer questions such as:
- When did the unwanted frequency component appear?
- Did it coincide with a switching edge, power-rail disturbance or digital event?
- Is the distortion continuous or associated with a short transient?
- How does the spectral content change during startup or state transitions?
A swept spectrum analyzer uses a frequency-selective RF receiver. It tunes across the frequency span, applies an intermediate-frequency resolution bandwidth (RBW) filter, and measures signal level at each frequency.
A narrower RBW improves signal separation and reduces displayed noise, but usually increases sweep time.
The spectrum analyzer’s advantage is not simply “more bits.” It comes from the complete RF signal path: input attenuation, preselection, mixer and local-oscillator performance, IF filtering, gain control, detector processing, and calibration.
This is why it resolves weak signals near stronger ones more reliably than a general-purpose oscilloscope. For transient events, an oscilloscope is usually the better tool for time-correlated waveform debug, while a real-time spectrum analyzer is better for detecting brief or intermittent activity within the RF spectrum.
Read more: New to RF measurement? Our guide to RF testing and radio-frequency measurement covers the essential terms and concepts used in this comparison.
Why Measurement Performance Differs
Oscilloscope FFT performance cannot be reduced to ADC resolution alone. An 8-bit ADC provides 256 quantisation levels; a 14-bit ADC provides 16,384.
Actual FFT performance also depends on:
- Oscilloscope noise floor
- Effective number of bits, or ENOB
- Front-end distortion
- Vertical scaling
- Sample rate and memory depth
- Acquisition mode
- FFT window
- Averaging
- Measurement bandwidth
Many general-purpose oscilloscopes use 8-bit ADCs, but that is not universal across the current Keysight lineup. The Keysight InfiniiVision HD3 Series uses a native 14-bit ADC. A universal “50 to 60 dB FFT limit” does not apply to every modern Keysight bench oscilloscope.
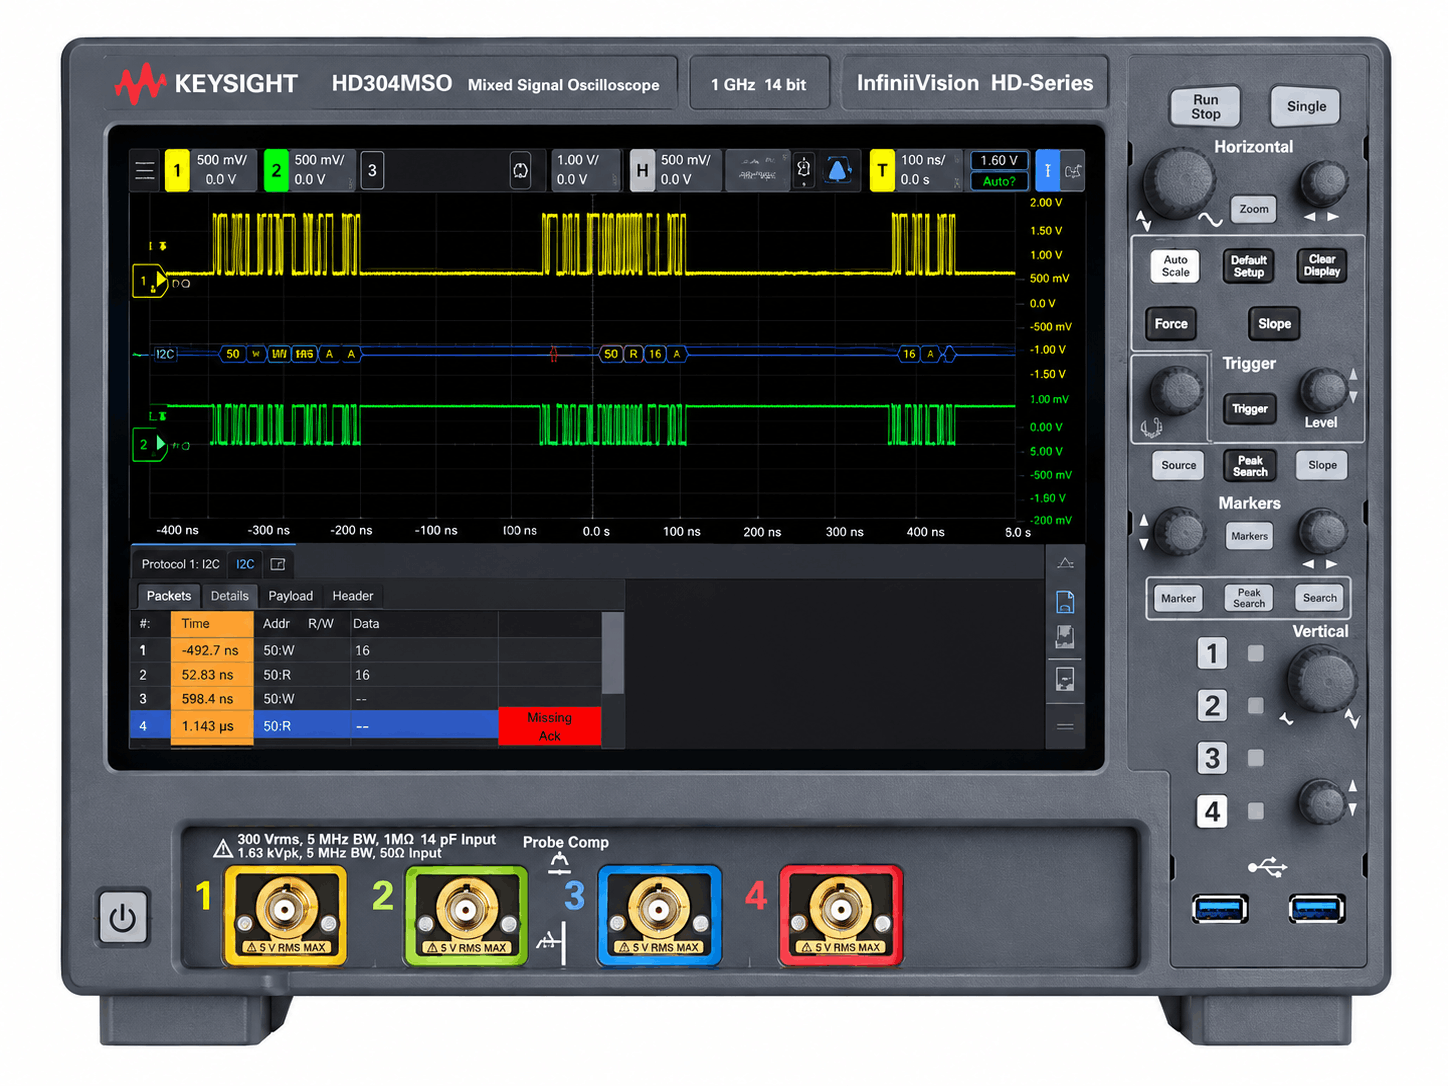
Keysight Technologies HD304MSO, Digital Oscilloscope, InfiniiVision HD3 Series, 1 GHz, 4 Analog Channels
A dedicated spectrum analyzer is built on a different architecture. Its ability to reveal weak signals depends on the complete measurement system, including input attenuation, preamplification, internal distortion, phase noise and resolution bandwidth.
Several specifications must be considered together.
Displayed Average Noise Level (DANL)
DANL is the spectrum analyzer’s internal noise floor under specified measurement conditions. Lower DANL means better sensitivity to weak signals.
- – 166 dBm for the N9020B MXA Signal Analyzer
- −152 dBm for the N9322C Basic Spectrum Analyzer.
- DANL varies with frequency, preamplifier, attenuation, RBW, detector, and averaging. Compare analyzers under equivalent measurement conditions.
- Do not express DANL in dBm/Hz unless the specification is explicitly normalised to a 1 Hz bandwidth.
- Express DANL in dBm/Hz only when the specification is explicitly normalised to a 1 Hz bandwidth.
Dynamic Range and Internal Distortion
Dynamic range is the ratio between the strongest and weakest signals the analyzer can measure together. When measuring a weak signal near a strong carrier, several factors matter:
- DANL
- Phase noise
- Residual and input-related spurious responses
- Harmonic distortion
- Third-order intermodulation performance
- Input attenuation and mixer level
A weak spur close to the carrier may be masked by phase noise; a signal farther out may be limited by noise floor or distortion.
Note: Do not assign a single spurious-free dynamic range (SFDR) figure to an analyzer unless Keysight specifies the test frequency, signal spacing, mixer level, RBW, and configuration.
Resolution Bandwidth (RBW) and FFT Resolution
RBW determines how effectively a spectrum analyzer separates closely spaced signals.
- Narrower RBW improves frequency resolution and lowers displayed noise.
- Narrower RBW normally increases sweep or acquisition time.
- The Keysight N9322C provides selectable RBW settings from 1 Hz to 3 MHz.
- RBW ranges vary between Keysight spectrum analyzer models.
An oscilloscope FFT determines resolution differently.
- A longer time record produces finer FFT frequency spacing
- Memory depth and sample rate setting the available resolution
- FFT window selection affects resolution, amplitude accuracy, and spectral leakage.
- An oscilloscope FFT can achieve sub-1 kHz spacing with a sufficiently long acquisition, but may still not deliver the calibrated RF sensitivity, phase-noise performance, or close-in dynamic range of a dedicated spectrum analyzer.
Read more: Wondering whether your scope’s bandwidth is the real bottleneck? Our guide on how to choose the right oscilloscope for your engineering work walks through the bandwidth, sample-rate, and memory depth decisions.
Three Checks for Choosing the Right Instrument
Do not apply a universal pass/fail threshold. Instead, compare your measurement requirement with the published performance of the specific oscilloscope or spectrum analyzer being considered.
Check 1: Can the Instrument Separate the Weak Signal From the Strong One?
Start with the strongest signal in your measurement. Determine how far below it the target signal is expected to appear.
For an oscilloscope FFT, compare the requirement against the instrument’s:
- Noise floor
- ENOB
- Harmonic and intermodulation distortion
- FFT performance
- Vertical range
- Available averaging and high-resolution modes
For a spectrum analyzer, consider:
- DANL
- Phase noise at the required carrier offset
- Residual spurious responses
- Second- and third-order distortion
- Input attenuation
- Preamplifier configuration.
A target 70 dB below a carrier is not automatically invisible to every oscilloscope, nor automatically measurable by every spectrum analyzer.
The outcome depends on the instrument, carrier frequency, signal spacing, and the type of distortion being measured.
Choose an oscilloscope FFT when the target sits comfortably above the scope’s measured FFT noise and distortion floor.
Choose a spectrum analyzer when the application requires reliable measurement of weak spurs, harmonics, or interference near stronger RF signals.
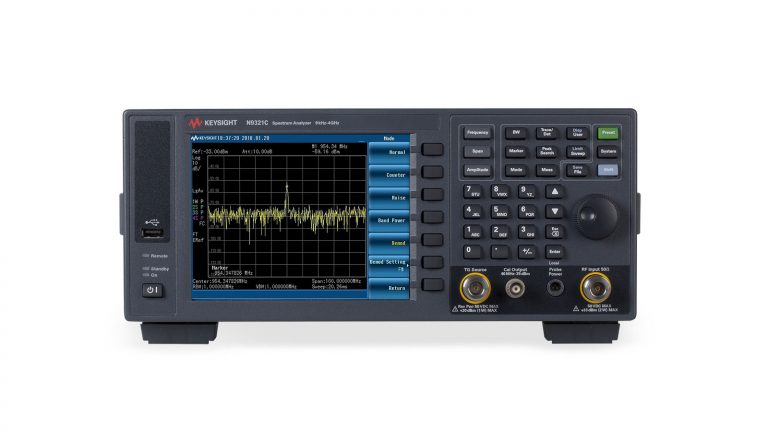
Keysight Technologies N9321C, Spectrum Analyzer, 9 kHz – 4 GHz
Check 2: Can the Instrument Provide the Required Frequency Resolution?
Determine:
- How closely spaced the signals are
- How narrow the signal of interest is
- What measurement bandwidth is required
- Whether phase noise must be measured at a specific carrier offset
- How much sweep time is acceptable
An oscilloscope FFT can provide fine frequency-bin spacing with a longer time record, though effective resolution also depends on FFT window and spectral leakage.
A spectrum analyzer provides selectable RBW filters and is generally more suitable when the measurement requires:
- Closely spaced frequency components
- Narrowband interference identification
- Low-level spur searches
- Close-in phase-noise measurements
- Calibrated RF power within a defined bandwidth.
Note: Base the decision on the required frequency separation and the selected instrument’s specifications, not an assumed 1 kHz dividing line.
Check 3: Is the Signal Continuous, Repetitive, or Intermittent?
A conventional swept spectrum analyzer measures successive portions of the frequency span at different times. A short event may occur while the analyzer is tuned elsewhere and therefore may not appear in the sweep.
An oscilloscope can trigger on a voltage or timing condition and capture the corresponding waveform, making it effective for:
- Switching-regulator events
- Startup behaviour
- Power-rail disturbances
- Time-correlated analog and digital faults.
However, it is inaccurate to claim that an oscilloscope “catches transients every time”. Detection depends on trigger configuration, event amplitude, acquisition memory, waveform update rate, and dead time between acquisitions.
When the objective is to detect intermittent activity in the frequency domain, a real-time spectrum analyzer (RTSA) may be the better choice. Real-time analysis uses overlapping FFT processing within a defined real-time bandwidth to reduce measurement gaps and improve the probability of intercept.
Use this distinction:
- Oscilloscope: best for triggered, time-correlated waveform investigation
- Swept spectrum analyzer: best for stable or repetitive frequency-domain measurements
- Real-time spectrum analyzer: best for detecting and analysing intermittent or rapidly changing RF-spectrum events
Still weighing the two for your own application? You do not have to decide alone. Tell Tekmark what you need to measure and where, and our team will help you match the requirement to the right Keysight instrument and send a quote.
Spectrum Analyzer vs Signal Analyzer: A Keysight Terminology Note
Keysight uses two labels for frequency-domain instruments, describing different levels of measurement capability.
Basic Spectrum Analyzers such as the N9322C and N9324C handle general RF spectrum work: carrier power, harmonics, occupied bandwidth, channel power, and interference analysis.
X-Series Signal Analyzers such as the N9000B CXA, N9020B MXA, N9030B PXA, and N9040B UXA combine spectrum analysis with expandable capabilities.
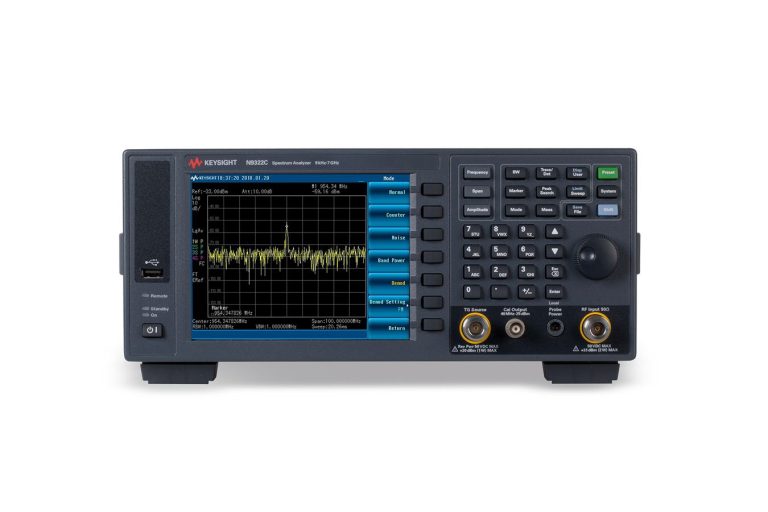
Keysight Technologies N9322C, Spectrum Analyzer, 9 kHz – 7 GHz
With the right hardware and software, an X-Series can add:
- Error vector magnitude (EVM) measurements
- Digital modulation and vector signal analysis
- 5G NR / LTE / Wi-Fi 6/7 applications
- Phase-noise and noise-figure measurements
- Real-time analysis
- Wider analysis bandwidth
For general RF work, an N9322C may suffice; for modulation-quality or wireless-standard measurements, step up to an X-Series with the required applications.
Read more: “Signal generator” hides a similar terminology trap on the signal-source side. Our guide on Keysight function generator vs signal generator explains the three-way distinction with named Keysight models.
When Keysight FieldFox Is the Right Choice
Once the required measurement capability is decided, consider where the measurement happens.
A benchtop analyzer usually offers higher performance, but is not always practical for cellular installation, on-site interference analysis, spectrum monitoring, site surveys, or reproducing an EMC issue at the deployment location.
For these applications, a handheld spectrum analyzer provides the portability, battery operation, and field-ready features required to complete the measurement on-site.

Keysight Technologies N9938B, FieldFox Handheld Microwave Spectrum Analyzer, 26.5 GHz
The Keysight Fieldfox B-Series includes:
- N9934B: Spectrum analysis from 9 kHz to 6.5 GHz
- N9938B: 9 kHz to 26.5 GHz, including selected 5G NR FR2 measurements
Depending on the model and installed options, FieldFox provides:
- Spectrum measurements with ±0.3 dB amplitude accuracy without warm-up
- Up to 120 MHz gap-free real-time analysis bandwidth
- Interference analysis and spectrogram displays
- Over-the-air 5G NR and LTE measurements
- I/Q data capture
- GPS/GNSS geolocation and timestamping
FieldFox is not a universal replacement for a benchtop signal analyzer.
Choose it when portability is essential and its frequency range, DANL, phase noise, and software options meet the measurement requirement. All FieldFox models are on Tekmark’s handheld analyzer e-shop catalog.
Spectrum Analyzer vs Oscilloscope: Application Shortlist
| Measurement | Recommended instrument | Example Keysight models |
| Dominant-frequency identification, basic harmonic checks, transient debugging | Scope-FFT | InfiniiVision 3000G X-Series (8-bit) or InfiniiVision HD3 Series (14-bit) |
| Wireless-module output spectrum, general RF measurements up to 7 GHz | Basic bench spectrum analyzer | N9322C (9 kHz to 7 GHz) |
| EVM, modulation quality, 5G / Wi-Fi 6-7, close-in phase noise | X-Series signal analyzer | N9020B MXA or N9030B PXA |
| Bench-level EMI troubleshooting and pre-compliance testing | X-Series with EMI application | N9020B MXA + N6141C |
| Intermittent RF event capture, spectrum monitoring | Real-time spectrum analyzer | N9030B PXA with real-time option |
| On-site cellular testing, RF site surveys, location-constrained EMI troubleshotting | FieldFox handheld spectrum analyzer | N9934B to N9938B for sub-7 GHz to 26.5 GHz |
The final selection should be based on signal frequency, required sensitivity, frequency resolution, analysis bandwidth, measurement location, and applicable compliance standard, not the instrument name alone.
Conclusion
Whether you need a spectrum analyzer or an oscilloscope comes down to the measurement, not the label on the instrument. Reach for an oscilloscope when timing, waveform shape, and transient behaviour matter most.
Choose a dedicated spectrum analyzer when weak-signal sensitivity, fine frequency resolution, and calibrated RF measurements decide the outcome. Many labs run both, because each gives a different view of the same system.
Once you know what you need to measure, the next step is matching it to the right model with the right support behind it.
Why choose Tekmark:
- Authorized Keysight distributor in your market
- Over three decades in test and measurement, from a distribution business established in 1994 to a regional technology solution provider.
- Local technical support across all three markets for specification, quotation, and after-sales questions.
- In-house R&D engineers who deliver system integration, not just equipment supply.
- Tekmark stocks Keysight’s core distribution range along with selected high-end instruments. For requirements beyond that range, such as mmWave above 26.5 GHz, high-power RF, or certified compliance work, our applications engineers confirm the configuration before you quote.
Tell us the measurement and the environment, and we will recommend the right instrument and prepare a quote.
FAQs
An oscilloscope FFT calculates the frequency content of a captured time-domain waveform. It is useful for basic harmonic analysis and for correlating spectral components with switching, timing, or transient events. A spectrum analyzer is designed for frequency-domain measurements and generally provides better sensitivity, frequency selectivity, and RF measurement accuracy for weak signals, spurious emissions, and phase noise.
There is no universal figure. Oscilloscope FFT performance depends on ADC resolution, ENOB, noise floor, front-end distortion, and FFT settings. Spectrum analyzer performance depends on DANL, phase noise, internal distortion, mixer level, attenuation, and RBW. Compare the actual instruments under equivalent conditions.
Use an oscilloscope FFT when you need to:
- Identify dominant frequency components
- Perform basic harmonic analysis
- Investigate switching noise
- Correlate frequency content with waveform timing
- Capture triggered or time-related transient behaviour
- Analyse analog and digital signals together
An oscilloscope is generally the better choice when understanding when and how the waveform changes are as important as identifying its frequency components.
Choose a dedicated spectrum analyzer when you need:
- Greater sensitivity to weak RF signals
- Fine and directly controlled RBW
- Accurate RF power measurements
- Spur and interference detection
- Closely spaced signal analysis
- Phase-noise measurements
- Occupied-bandwidth or adjacent-channel-power measurements
- EMI troubleshooting and pre-compliance testing
An oscilloscope with FFT can perform basic frequency analysis but does not fully replace a spectrum analyzer. It may suffice for dominant-frequency identification, harmonic investigation, and time-correlated debug. A dedicated spectrum analyzer is more appropriate for low-level RF signals, narrowband measurements, interference hunting, and calibrated power measurements. Many labs use both because they provide complementary views of the same system.
An oscilloscope with FFT and a near-field probe can help identify switching harmonics and locate emission sources during design debug. It does not provide the detectors, bandwidths, and measurement functions required for standards-based EMI testing. For structured pre-compliance work, use a Keysight X-Series Signal Analyzer with the N6141C EMI application. Formal compliance testing requires a standards-compliant EMI receiver and an accredited test environment.
A spectrum analyzer focuses on measuring signal power across frequency. A Keysight X-Series Signal Analyzer performs spectrum measurements and can be configured with additional software for modulation analysis, EVM, phase noise, noise figure, and 5G NR / LTE / Wi-Fi measurements. Capabilities depend on hardware, analysis bandwidth, and software licences.
Keysight FieldFox is a practical alternative when the measurement must be performed on-site. The N9938B covers frequencies up to 26.5 GHz, weighs approximately 3.4 kg and provides ±0.3 dB spectrum measurement accuracy without warm-up. With the required options, it supports up to 120 MHz gap-free real-time analysis bandwidth.
For laboratory measurements requiring higher dynamic range, lower phase noise, wider analysis bandwidth or advanced modulation analysis, a benchtop signal analyzer may be more suitable. The choice depends on measurement performance and location, not portability alone.
Related Articles